呜呜呜呜,要是我能跟高卷杏在渋谷逛街,或是一起去看樱花,就不用学习了,真是太好了!P5 天下第一!
Jim 在写这篇文章的时候在纠结,「Figure Layering in Matplotlib」这个名字用于这篇文章是否合适。其实这篇文章更想探讨的是 subplot 怎么在一个 figure 上进行叠加。
背景
我们来看一篇文章:https://doi.org/10.1016/j.isci.2024.109079。这篇文章的摘要图是这样的:
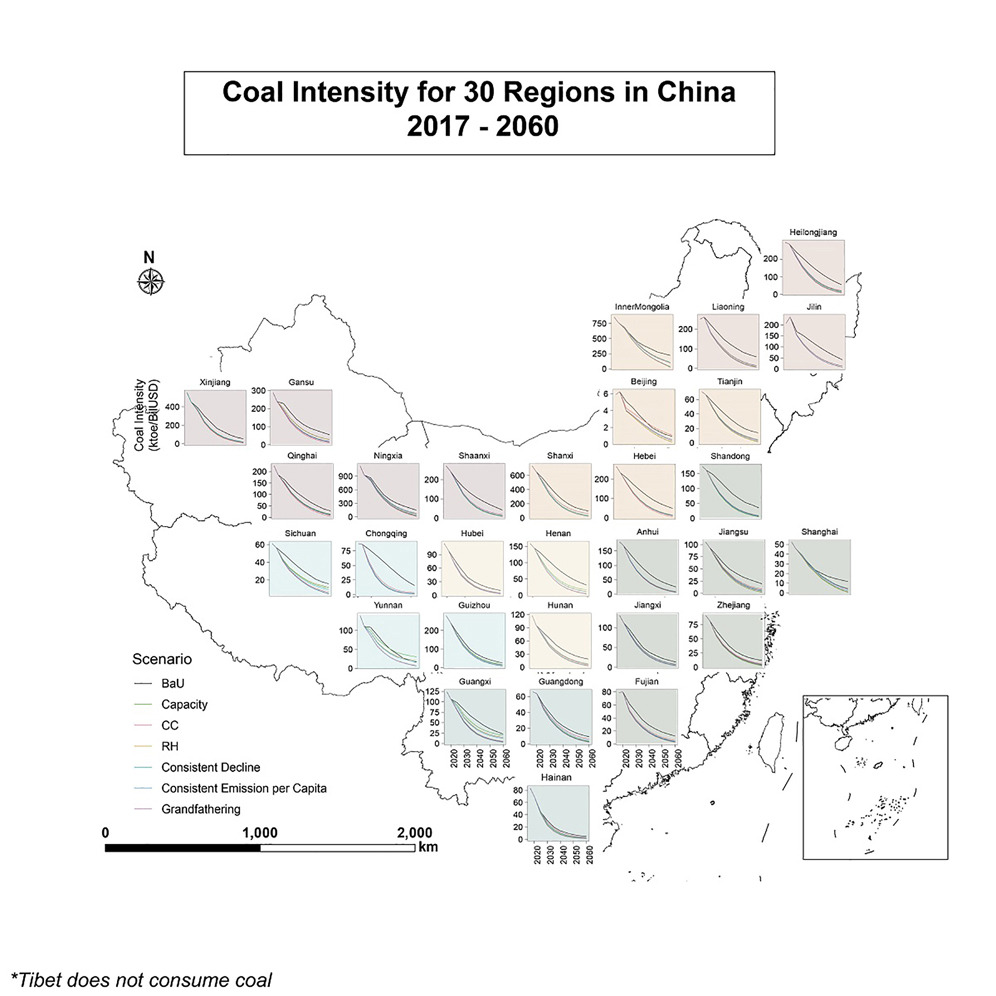
当然,图的创意很好啦!这也是在绘制分省减排路径图的时候,非常常见的一种绘制方法。但是仔细一看不难发现,作者是用一些后期处理工具拼起来的,而并不是通过代码生成的。那么,能不能用代码来生成这样的图呢?对 Jim 来说,当然是可以的!
问题拆解
所以问题很明显地摆在我们的面前:我们是不是做两个图层的叠加——一个是中国地图,一个是折线图组合——然后把它们叠加在一起呢?这个问题的答案是肯定的。那么来看看怎么做。
代码实现
先画地图!
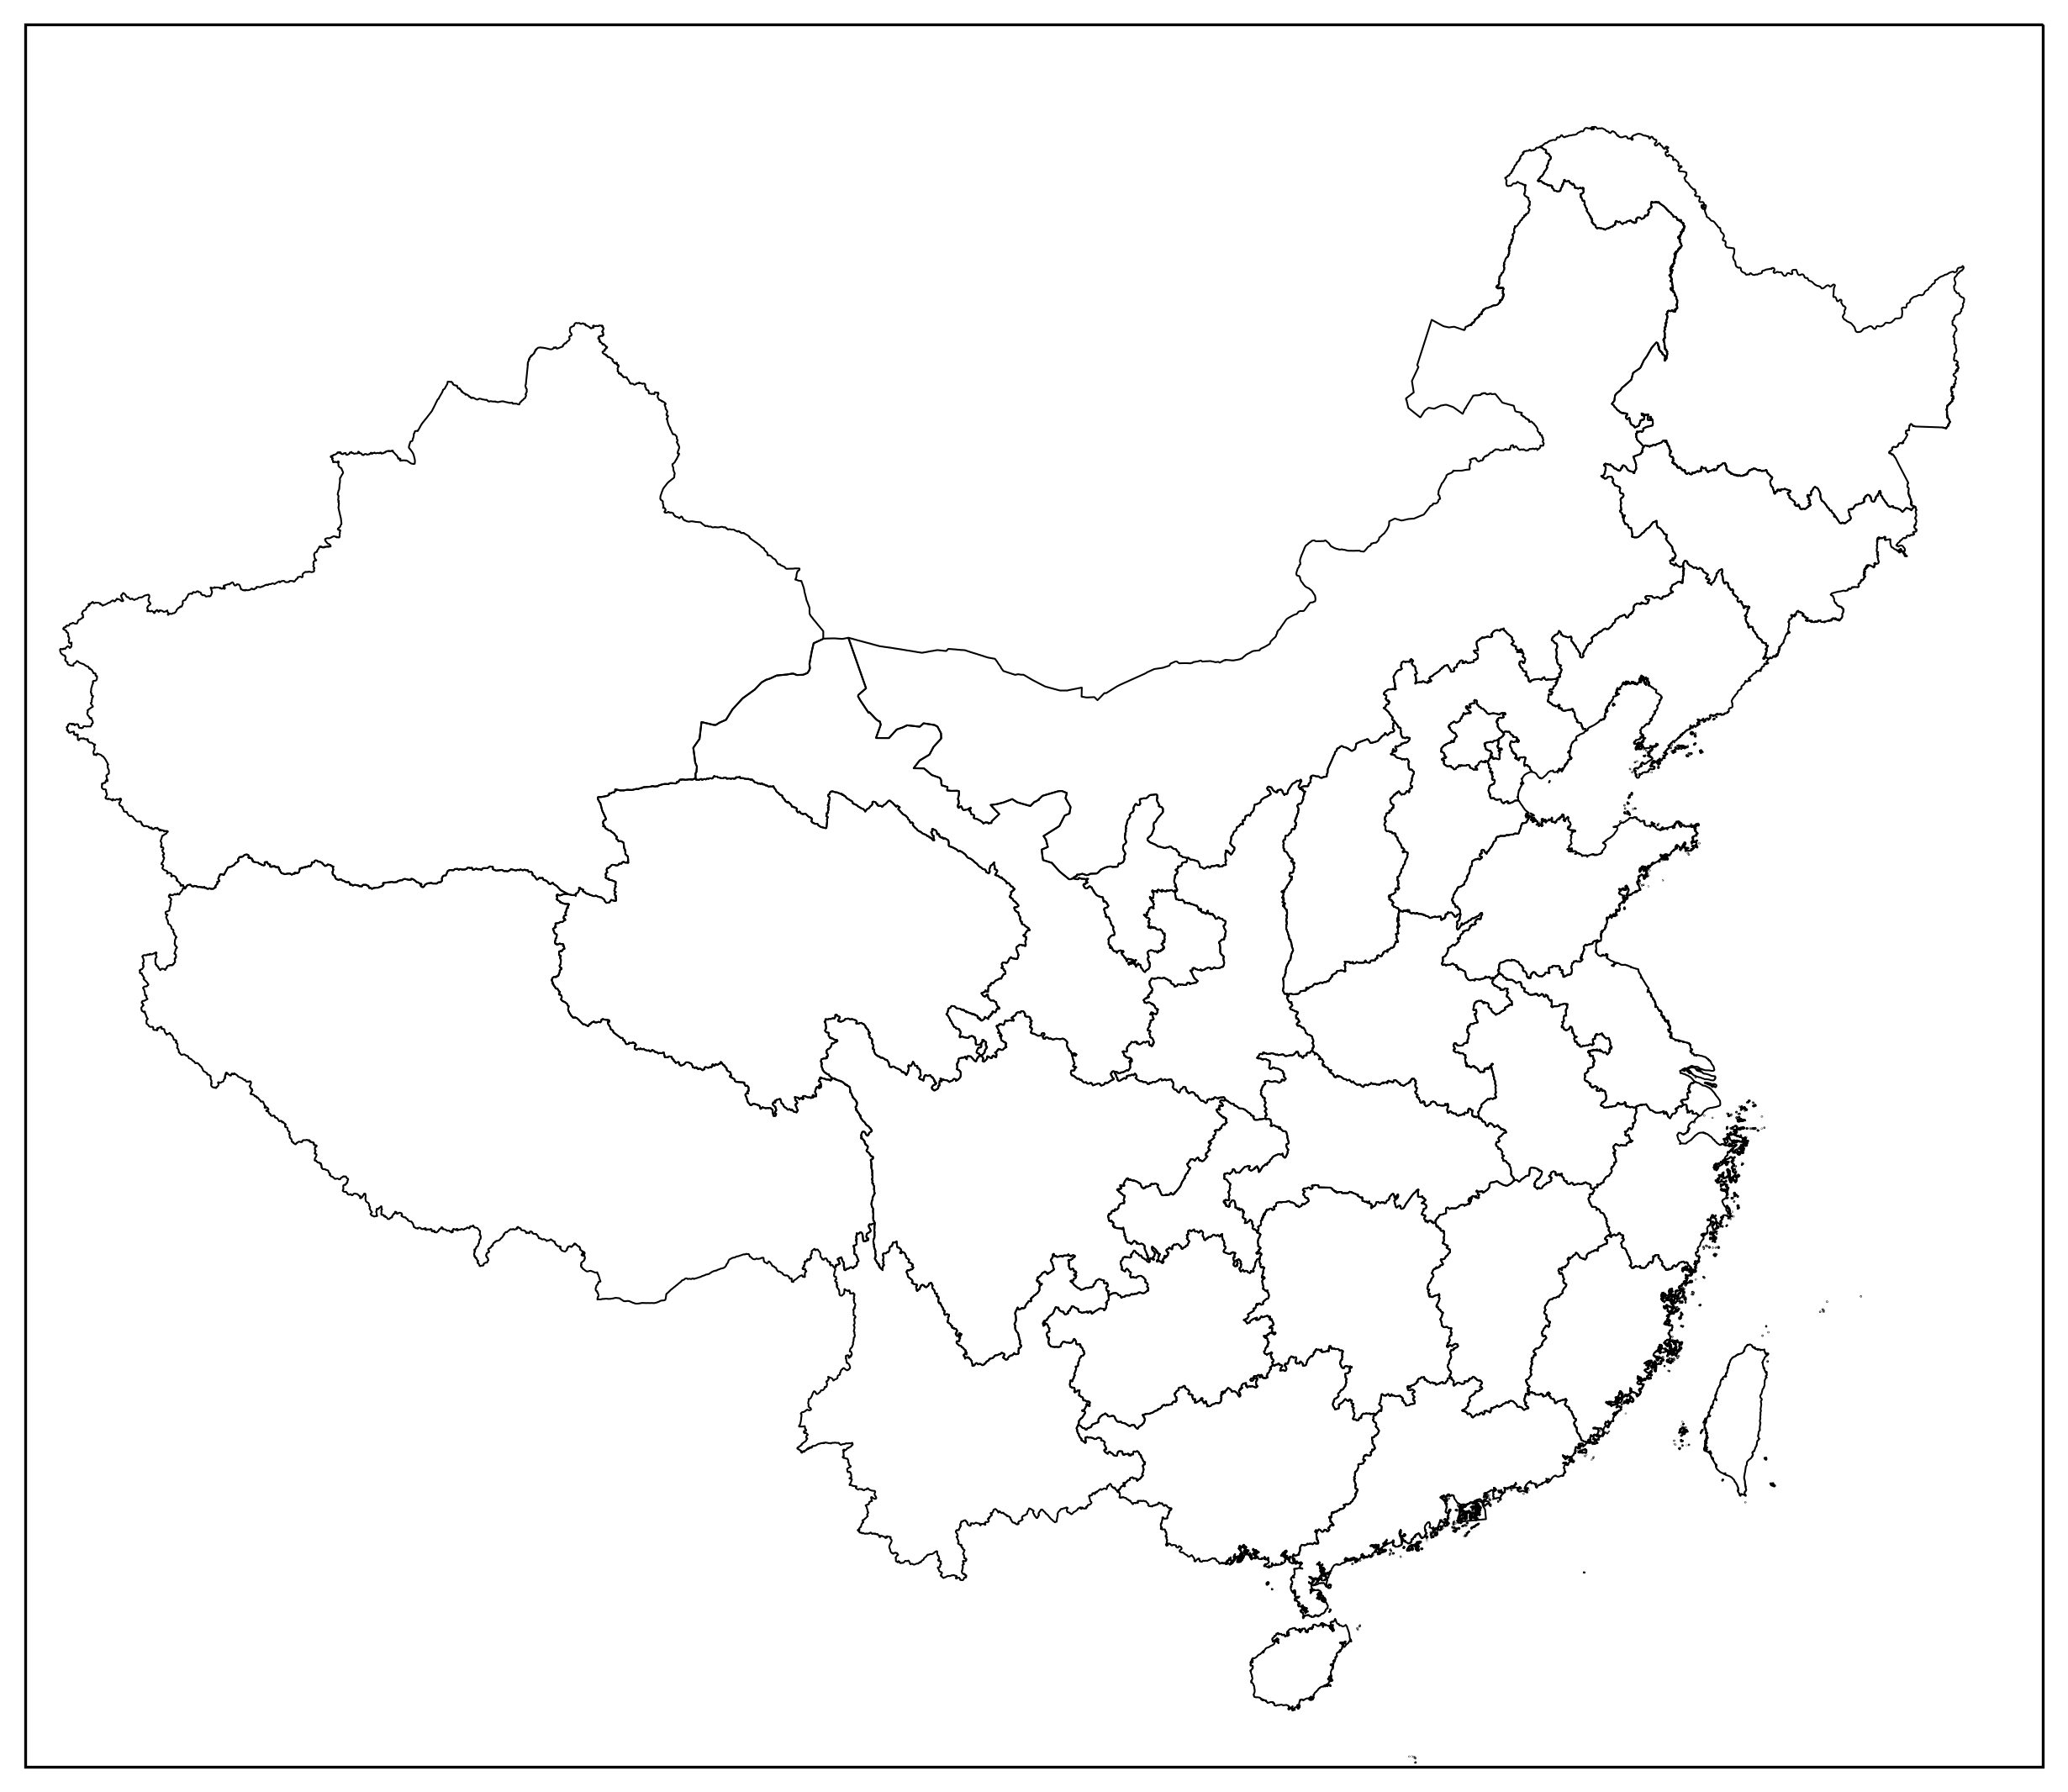
首先,我们需要画一个中国地图。在前面的文章「利用 Python 地理制图与 NetCDF 数据处理」中,Jim 已经给大家画好了底图:
import cartopy.crs as ccrs
from cartopy.io.shapereader import Reader
from cartopy.feature import ShapelyFeature

import matplotlib.pyplot as plt
import matplotlib as mpl

province_line = 'province/province.shp' # 我把省界的 shapefile 文件放在了 province 文件夹下,当然只有 shapefile 文件是不够的,还需要其他的文件,这里就不展开了。
province_feature = ShapelyFeature(
    Reader(province_line).geometries(),
    crs=ccrs.PlateCarree(),
    facecolor='none'
)

globe = ccrs.Globe(ellipse='GRS80')

lcc = ccrs.LambertConformal(
    central_longitude=105,
    central_latitude=36,
    standard_parallels=(25, 47),
    globe=globe
)

fig = plt.figure(figsize=(10, 12))

ax_main = fig.add_axes([0.1, 0.3, 0.8, 0.6], projection=lcc)  # [left, bottom, width, height]
ax_main.add_feature(province_feature, edgecolor='black', linewidth=0.5)
ax_main.set_extent([80, 127, 17, 55], crs=ccrs.PlateCarree())
和之前的 extent 不同,我们这次把 extent 设置为 [80, 127, 17, 55],比之前的范围要小一些。这样我们就可以把中国的地图画出来了:
再画上面的图
接下来,我们需要画上面的图。我们这里直接将上层的图叠上去就好了。那么,我们这里用 frameon=False 来去掉坐标轴,然后将上层的图叠上去:
# 前面的部分不再赘述

fig = plt.figure(figsize=(10, 12), frameon=False)

ax_main = fig.add_axes([0.1, 0.3, 0.8, 0.6], projection=lcc)  # [left, bottom, width, height]
ax_main.add_feature(province_feature, edgecolor='black', linewidth=0.5)
ax_main.set_extent([80, 127, 17, 55], crs=ccrs.PlateCarree())
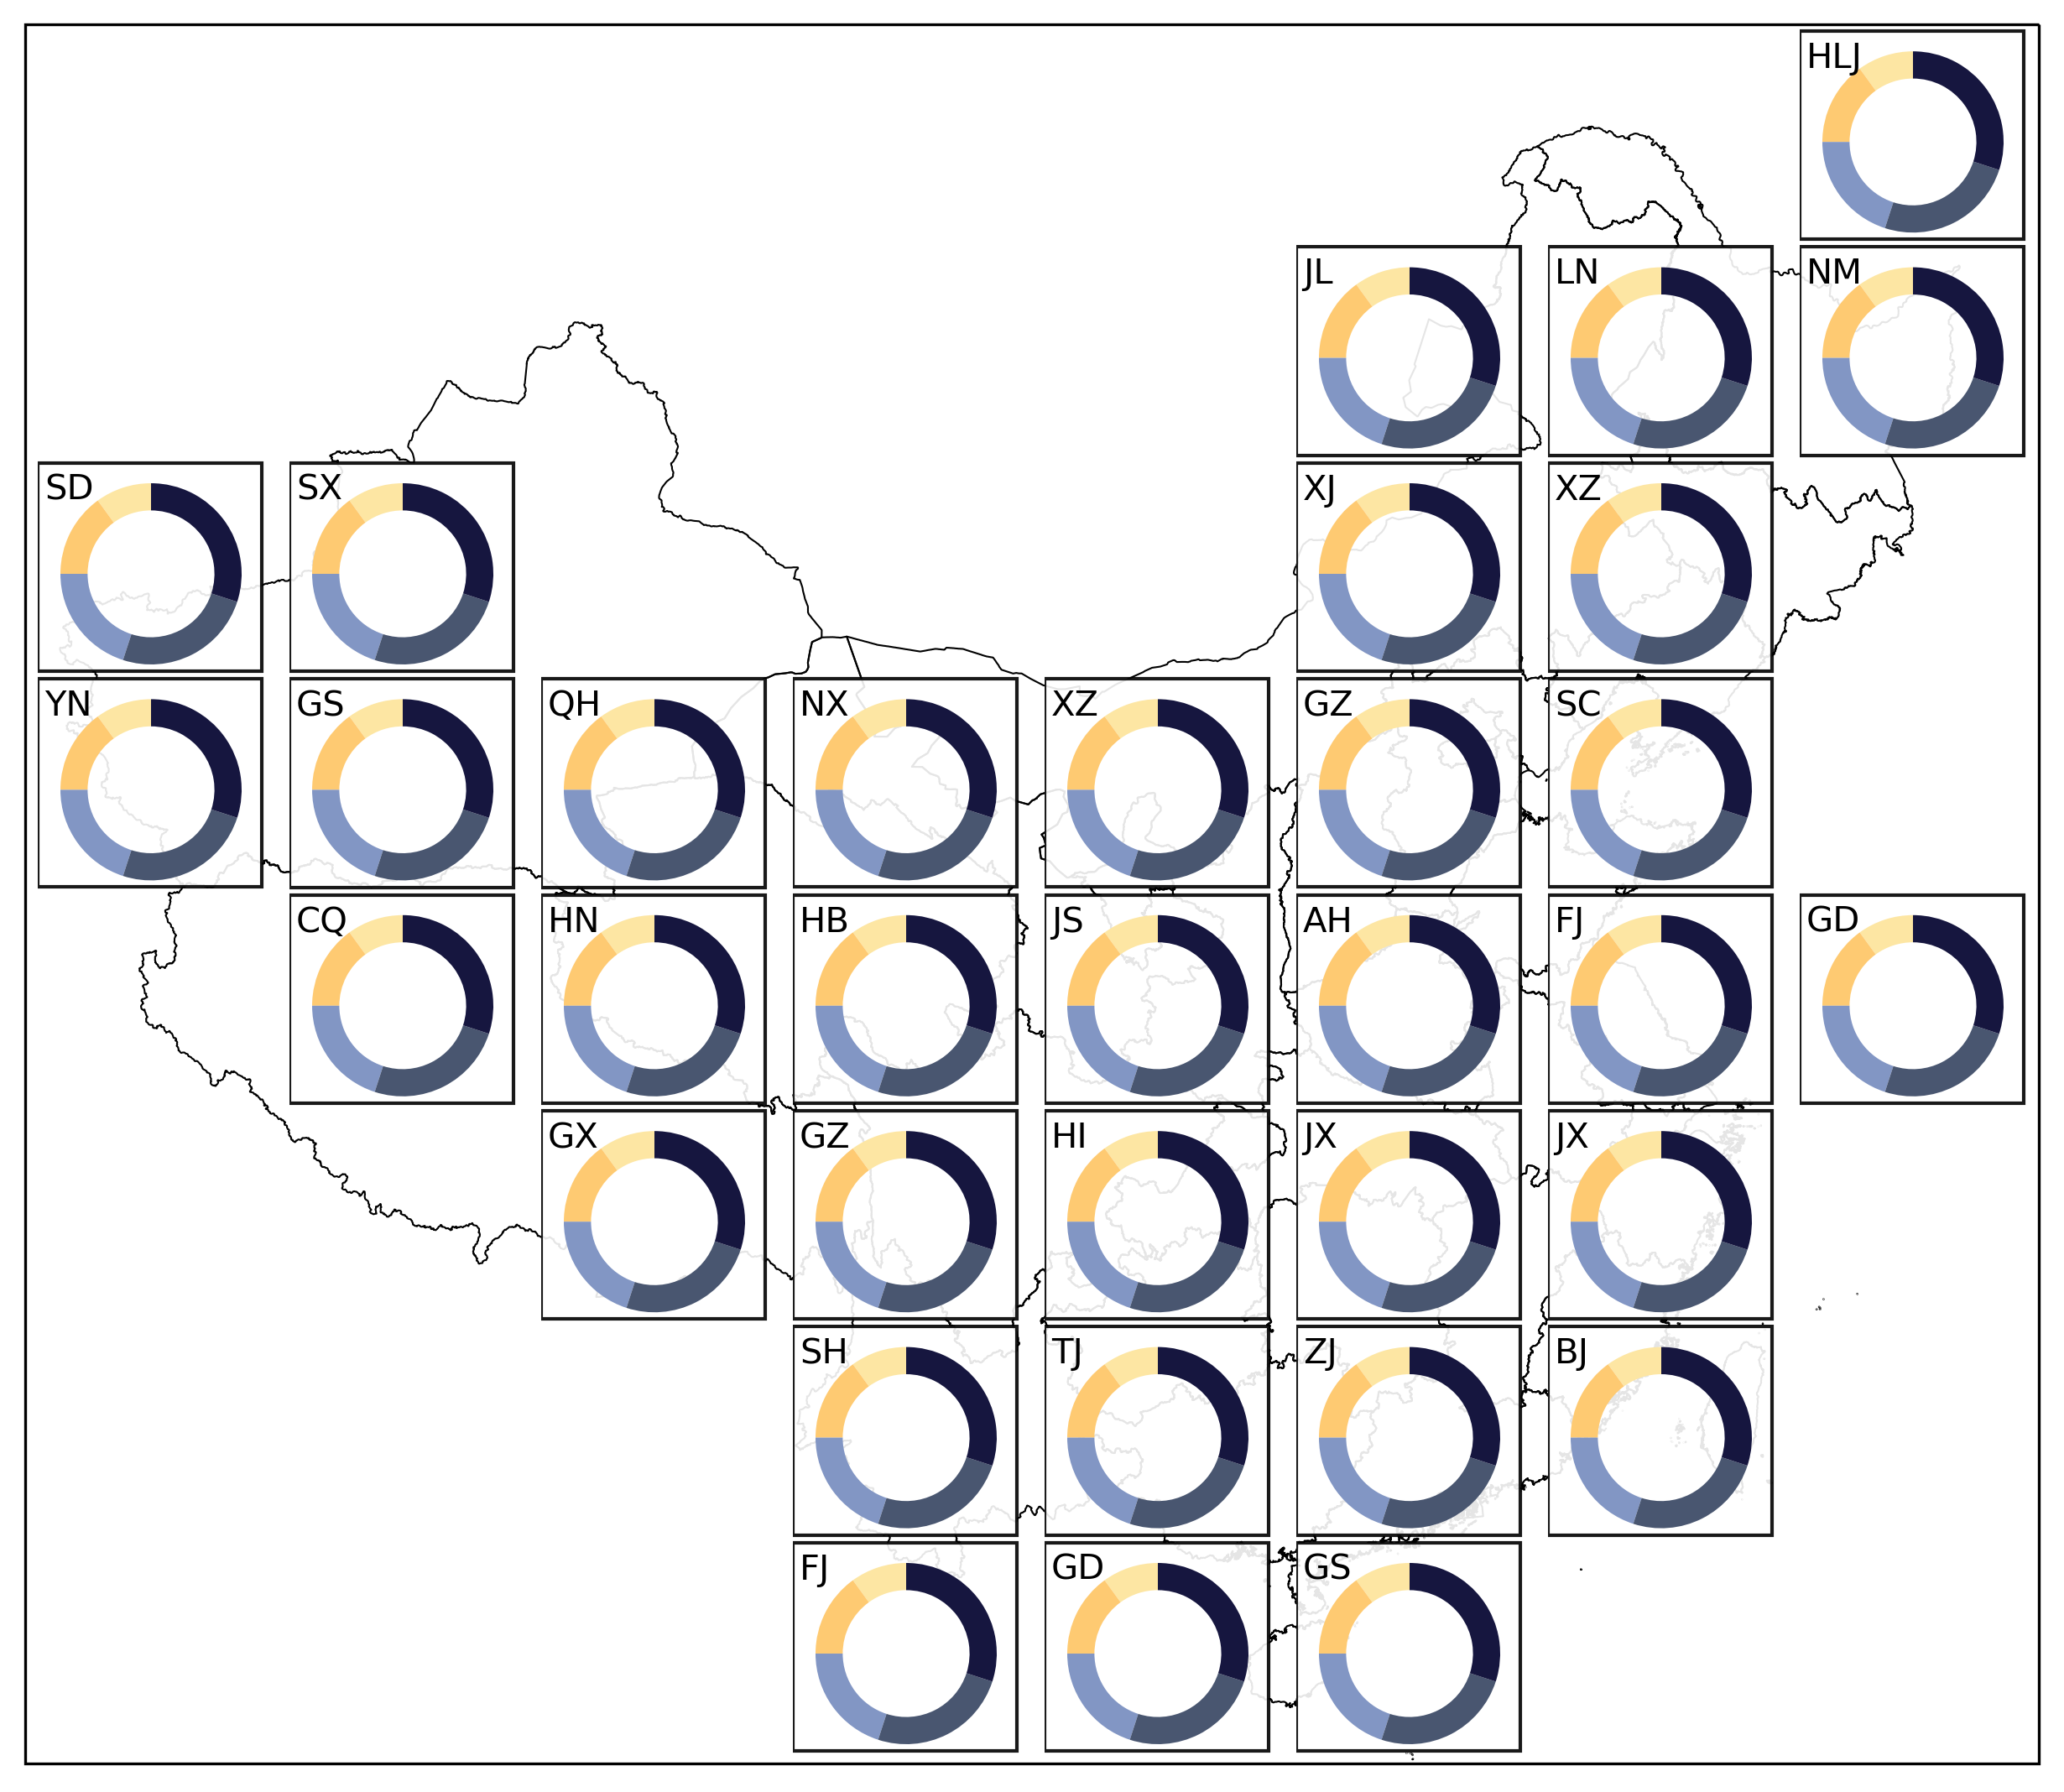
接下来需要思考一下,我们怎么做子图拼接?我们来用另外一种方式画上面的图。我们先做一个8*8的网格,然后在接下来的每一部分都有填充:
| col 0 | col 1 | col 2 | col 3 | col 4 | col 5 | col 6 | col 7 | |
|---|---|---|---|---|---|---|---|---|
| row 0 | X | |||||||
| row 1 | X | X | X | |||||
| row 2 | X | X | X | X | ||||
| row 3 | X | X | X | X | X | X | ||
| row 4 | X | X | X | X | X | X | X | |
| row 5 | X | X | X | X | X | |||
| row 6 | X | X | X | X | ||||
| row 7 | X | X | X |
注:这里 Jim 觉得 (2, 0) 和 (4, 0) 应该对调一下。
然后每一个 X 都是一个子图,我们可以用 fig.add_axes 来添加子图。但是先别急!我们先把每一个子图画好:
from matplotlib import patches

axs = {}

def add_pie(x: int, y: int, certain_data: np.ndarray, num: int) -> None:
    colors = ['#fde6a3', '#feca72', '#8296c4', '#495670', '#16163f'] # Navia Color Palette: https://www.color-hex.com/color-palette/1038553
    amount = certain_data.sum() # variable 'amount' is not used here, but it's useful in the future

    axs[(x, y)] = fig.add_axes(position[x * 8 + y])
    rect = patches.Rectangle((0, 0.07), 0.99, 0.92, transform=axs[(x, y)].transAxes, facecolor='white', zorder=-1, edgecolor='black', alpha=.9)
    axs[(x, y)].add_patch(rect)
    axs[(x, y)].pie(certain_data, colors=colors, startangle=90, wedgeprops=dict(width=.3))
    axs[(x, y)].text(0.03, 0.87, mapping[(x, y)], horizontalalignment='left', verticalalignment='center', transform=axs[(x, y)].transAxes)
这样我们就可以把每一个子图画好了。然后我们再把每一个子图叠上去:
# line 0: (0, 7)
# line 1: (1, 5), (1, 6), (1, 7)
# line 2: (2, 0), (2, 1), (2, 5), (2, 6)
# line 3: (3, 0), (3, 1), (3, 2), (3, 3), (3, 4), (3, 5), (3, 6)
# line 4: (4, 1), (4, 2), (4, 3), (4, 4), (4, 5), (4, 6), (4, 7)
# line 5: (5, 2), (5, 3), (5, 4), (5, 5), (5, 6)
# line 6: (6, 3), (6, 4), (6, 5), (6, 6)
# line 7: (7, 3), (7, 4), (7, 5)

l_axis = [(0, 7), (1, 5), (1, 6), (1, 7), (2, 0), (2, 1), (2, 5), (2, 6), (3, 0), (3, 1), (3, 2), (3, 3), (3, 4), (3, 5), (3, 6), (4, 1), (4, 2), (4, 3), (4, 4), (4, 5), (4, 6), (4, 7), (5, 2), (5, 3), (5, 4), (5, 5), (5, 6), (6, 3), (6, 4), (6, 5), (6, 6), (7, 3), (7, 4), (7, 5)]
l_title = ['HLJ', 'JL', 'LN', 'NM', 'SD', 'SX', 'XJ', 'XZ', 'YN', 'GS', 'QH', 'NX', 'XZ', 'GZ', 'SC', 'CQ', 'HN', 'HB', 'JS', 'AH', 'FJ', 'GD', 'GX', 'GZ', 'HI', 'JX', 'JX', 'SH', 'TJ', 'ZJ', 'BJ', 'FJ', 'GD', 'GS']

mapping = {l_axis[i]: l_title[i] for i in range(len(l_axis))}

# determine the position of the axes 8x8
position = []
for i in range(8):
    for j in range(8):
        # for (0, 7): [0.75, 0.8, 0.1, 0.1], for (1, 5): [0.55, 0.5, 0.1, 0.1], for (1, 6): [0.65, 0.5, 0.1, 0.1]
        height = 0.09
        position.append([0.105 + j * 0.1, 0.804 - i * 0.0715, height, height])

for i, (x, y) in enumerate(l_axis):
    certain_data = [10, 15, 20, 25, 30]; certain_data = np.array(certain_data)
    add_pie(x, y, certain_data, i)

plt.savefig('pie.png', dpi=300, bbox_inches='tight', pad_inches=0.1)
这样我们就可以把上层的图叠上去了,be like: